Let's look at the first half of my report about the charts below.
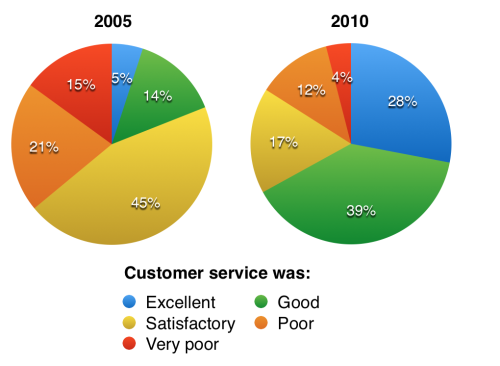
The charts below show the results of a questionnaire that asked visitors to the Parkway Hotel how they rated the hotel's customer service. The same questionnaire was given to 100 guests in the years 2005 and 2010.
Introduction and overview / summary:
The pie charts compare visitors’ responses to a survey about customer service at the Parkway Hotel in 2005 and in 2010.
It is clear that overall customer satisfaction increased considerably from 2005 to 2010. While more than half of the hotel guests surveyed rated customer service as satisfactory or poor in 2005, a clear majority described the hotel’s service as good or excellent in 2010.


0 Comments